Description
In this project, 8 theory questions have been done in Aspen Plus and Hysys software, which are as follows.
Exercise 1
Question 1:
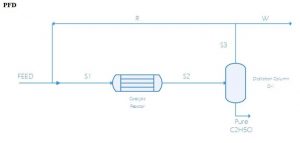
Simulation of ethyl chloride process in Aspen Plus and Hysys software. The figure below shows the PFD of the ethyl chloride production process.
Question 2:
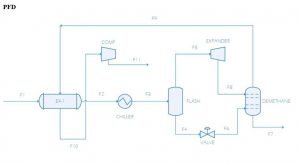
Simulation of demethanization unit in Aspen Plus and Hysys software and calculation of boil up ratio. The figure below shows the PFD of the methanation process.
Exercise 2
Question 1:
Completing the basic data bank required for the synthesis of vinyl chloride production process
Question 2:
In the synthesis of the vinyl chloride production process, continue the scenario of Reaction Path 5 until the end. In each step, follow one of the possible paths from the synthesis tree. Use Aspen plus software to determine the temperature or the composition of process flow components (flash calculations).
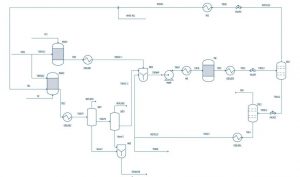
The following questions are simulated in Aspen Plus. The figure below shows the PFD diagram of the vinyl chloride production process.
Exercise 3
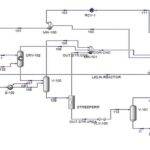
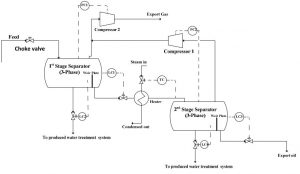
In the process whose simple P&ID is given below. The pressure of the hydrocarbon output from a tank is reduced after passing through the choke valve. and enters the three-phase separator of the first stage. In this separator, gas, oil and water are separated from each other The pressure of this separator is controlled by compressor number 2 and the oil and water levels are also controlled by two control valves installed in the oil and water outlet lines.
Considering that not all water and gas have been separated from oil yet. Again, the pressure of the oil output from the first separator after passing through the oil level control valve is reduced. And then the temperature of this flow increases after passing through a shell and tube exchanger and enters the second stage separator. How to control the pressure and control the levels of the second separator is also shown on the figure. It is desirable to apply the HAZOP method for this process and prepare its final report.
Exercise 4
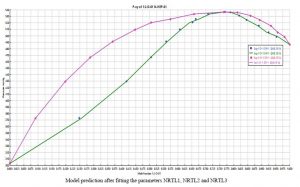
Regression of laboratory data of an article
Exercise 5
Question 1:
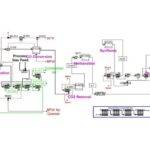
Simulate the following process in Aspen Plus in all 3 states.
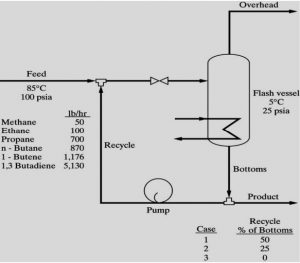
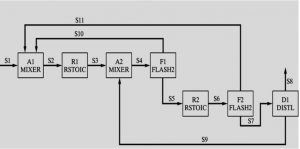
Question 2: The flow diagram of a process simulated by Aspen plus is available as shown below. Assume that the feed and process equipment specifications are given to the software. After running the program, what order does the software consider for solving the devices (calculation sequence). Suggest another order for solving the devices (by showing the location of convergence blocks.)
Exercise 6
Question 1:
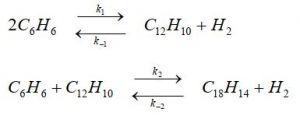
Simulation of an Aspen Plus dose reactor with the following reactions:
Question 2:
In a catalytic gas reactor, the following two equilibrium reactions take place:

If the molar rate of A and B at the reactor inlet is equal to 5.5 and (kmol/hr) 8.5, respectively. Calculate the molar rate of the components coming out of the reactor assuming chemical equilibrium and ideal gas. If you wish, you can use fsolve function in MATLAB software to solve the resulting nonlinear device.
Exercise 7
Question 1:
Ammonia converter unit simulation
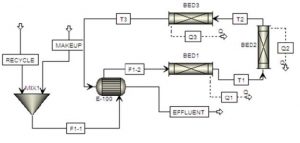
Question 2:
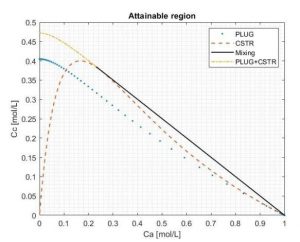
Modeling 3 parallel reactions in the plug reactor using MATLAB software
Question 3:
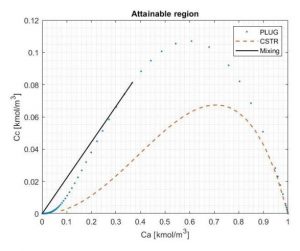
Modeling 4 consecutive reactions in MATLAB software
Exercise 8
Question 1:
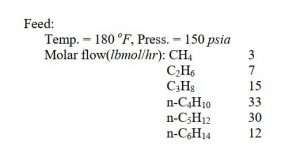
The following hydrocarbon mixture is distilled in a typical distillation tower. 99% of the input propane and 1% of the input butane are transferred to the product at the top of the tower. Consider propane as a light key component and butane as a heavy key component. Simulate the following mixture separation unit in Aspen Plus software.
Question 2:
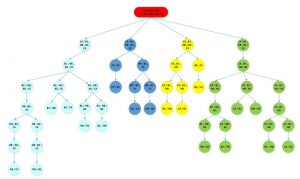
Tree diagram of separation states of 5 different materials
