Introduction
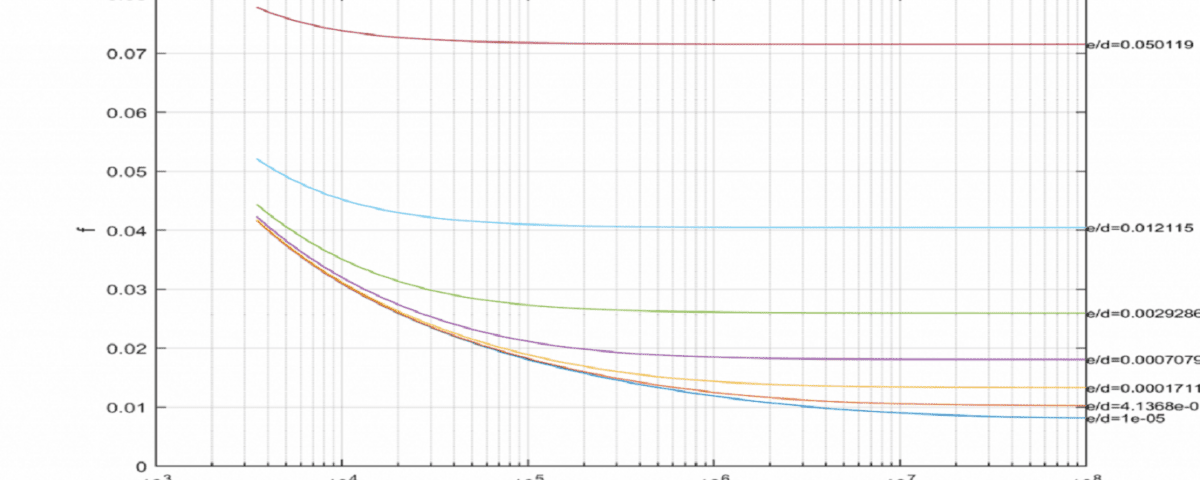
The Moody diagram is a fundamental tool in hydraulic engineering, lubrication, and fluid flow analysis. It graphically represents the relationship between the Darcy-Weisbach friction factor, Reynolds number, and relative roughness of a pipe. This diagram is invaluable to engineers and designers involved in hydraulic systems, as the friction factor directly influences pressure drop and overall system efficiency.
MATLAB, a powerful programming and computational environment, offers an effective platform for generating accurate and customizable Moody diagrams. By leveraging MATLAB’s graphical capabilities, the Moody diagram can be automatically generated and updated based on varying parameters such as Reynolds number and relative roughness. This enables engineers to quickly obtain results and incorporate them into their designs.
This research focuses on developing a MATLAB-based script to construct a comprehensive Moody diagram. Through data analysis and the implementation of relevant mathematical equations governing the friction factor and Reynolds number, a versatile and practical diagram will be produced. The generated diagram can significantly enhance the accuracy of hydraulic calculations and optimize the design of fluid transport systems.
Moody Chart and MATLAB Coding
The Moody chart, a graphical representation of the Darcy-Weisbach friction factor, is widely used in fluid mechanics courses across various engineering disciplines, including mechanical and chemical engineering. Derived from the Colebrook equation, this chart is essential for determining the friction factor in pipe flow calculations.
Given the implicit nature of the Colebrook equation with respect to the friction factor, plotting the Moody chart requires iterative numerical methods. This project provides a MATLAB code specifically designed for this purpose. By purchasing this product, you’ll not only obtain the code but also acquire the necessary skills to create various plots using MATLAB. Ultimately, you’ll be able to generate a Moody chart independently, without relying on reference books.
This MATLAB script consists of 31 lines and comes with a comprehensive report. It offers a practical approach to visualizing the Moody chart and reinforces numerical methods concepts taught in fluid mechanics courses.


