Introduction
Ethyl acetate is a vital solvent in the polymer and petrochemical industries. Due to its unique characteristics, including flammability, volatility, and sweet odor, it can be detected even at very low concentrations (7-50 ppm). This organic compound, with the chemical formula C4H8O2, is also known by other names such as ethyl acetate, ethoxyethane, and acetic acid ethyl ester. Ethyl acetate is well-soluble in common organic solvents like alcohols, ketones, and glycols. However, its solubility in water at room temperature is less than 25% (approximately 8 grams per 100 milliliters of water). As the temperature increases, its solubility in water improves.
Properties of Ethyl Acetate
Today, innovative methods such as reactive distillation are used for the production of ethyl acetate, which offer greater advantages over traditional methods. One important property of ethyl acetate is its lipophilicity. Due to its saturated ester structure, its chemical reactivity is relatively slow, resulting in lower toxicity compared to other industrial solvents. This solvent has widespread applications in the production of various materials, including nitrocellulose, cellulose acetate, paints, cosmetics, polymer solutions, and adhesives. However, prolonged exposure to ethyl acetate may lead to symptoms such as weakness, drowsiness, lack of concentration, and irritation of the nose and throat. At very high concentrations, this substance can have depressant effects on the central nervous system and can even be fatal. Therefore, the recovery of volatile organic compounds like ethyl acetate and the reduction of its concentration in effluent streams have attracted the attention of industries and research centers due to environmental concerns.
The choice of ethyl acetate as an adsorbate is influenced by its presence as a volatile compound in many fruits (such as apples and grapes). In the process of extracting essential oils from these fruits using supercritical carbon dioxide, there is a potential for contamination of the carbon dioxide effluent with ethyl acetate.
Objectives Under Investigation
1. Simulation of an adsorption column for the removal of ethyl acetate from air.
2. Process optimization within the model.
3. Evaluation of model accuracy against other data.
4. Sensitivity analysis of the process and identification of more influential process variables.
Considering that the adsorption process of ethyl acetate from air is a transfer phenomenon, it can be simulated using transfer equations. The activated carbon adsorption column, due to its very high specific surface area, can effectively remove ethyl acetate from the air.
Selected Equation of State
In this study, a suitable model for simulating the adsorption process aimed at the removal of ethyl acetate from air in a fixed-bed adsorption column filled with activated carbon has been developed using the balance equations of mass, energy, and momentum. The selected equation of state for modeling is the Peng-Robinson equation, which is used as a base state in Aspen Plus software. This equation, due to its high accuracy and three-parameter nature, has less error compared to two-parameter equations such as van der Waals and Virial equations, while being simpler than more complex equations (such as BWR). Additionally, the momentum balance equation used is the Ergun equation, which is suitable for both laminar and turbulent flows. It combines the pressure drop equation of Burke-Plummer (for turbulent flow) and the Carman-Kozeny equation (for laminar flow).
Innovation of The Research
The main differences between this research and previous studies are as follows:
– Utilization of the Peng-Robinson equation of state for modeling.
– Employment of the Ergun equation for momentum balance, which is suitable for both laminar and turbulent flows.
– Examination of the effects of various variables such as temperature, inlet concentration, bed height, overall mass transfer coefficients, inlet gas velocity, saturation capacity of activated carbon, and molecular diffusion of components.
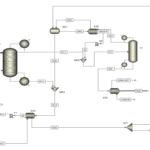
Simulation and Process
The model simulation has been conducted using Aspen Plus software. The simulation environment includes an area where streams, unit operations, columns, and branch flow sheets are defined and configured. Isothermal simulations have been performed for a range of ethyl acetate inlet concentrations at three temperatures: 30, 45, and 55 degrees Celsius. The process for removing ethyl acetate pollution occurs in the following four stages:
High-Pressure Adsorption:
In this stage, ethyl acetate is adsorbed by activated carbon.
Flow Discharge:
The system pressure is reduced.
Low-Pressure Desorption:
The adsorbed ethyl acetate is separated from the activated carbon.
Counter Flow:
The system is prepared for the next cycle
In stages 1 and 2, the bed is cooled using a cooling jacket, while in stages 3 and 4, it is heated using an electric heating system. Stage 1 is conducted at a constant feed rate and stops when the column pressure reaches the operating pressure of stage 2. Stage 2 ends when the molar fraction of ethyl acetate in the effluent stream reaches 5% of its molar fraction in the inlet stream.
Adsorption Column Specifications
The column used in this research is made of stainless steel and has a length of 40 centimeters, with 20 centimeters filled with activated carbon. The upper and lower sections of the column are filled with glass beads (4 millimeters) to ensure uniform gas distribution. A thermocouple is installed at the top of the column to monitor the temperature at various axial points of the bed.
Application of Response Surface Methodology for Mathematical Model Extraction
In this research, Response Surface Methodology (RSM) is employed to extract the mathematical model and identify the most influential variables. This method designs an experimental matrix while considering the number of variables and the specified ranges for each variable. This approach reduces the number of tests and determines the levels of each variable in every experiment. RSM is particularly more efficient and cost-effective than cumbersome methods such as full factorial designs when the number of variables is high. It provides reliable statistical results without the need for repeated experiments and generally facilitates the research process, reducing time and costs.
Response Surface Methodology
There are three main methods in response surface design:
1. Central Composite Design (CCD)
2. Box-Behnken Design
3. Doehlert Design
Among these methods, the Central Composite Design is the most recognized and widely used in research.
Advantages of Response Surface Methodology
– Reduction in the number of experiments, leading to savings in time and costs.
– The ability to simultaneously examine multiple variables and determine their interactions.
– Provision of reliable statistical results even without the need for repeated experiments.
– Facilitation of the optimization process and identification of optimal conditions.
Determination of Independent Variable Levels
In response surface methodology, the selected range for each factor is of great importance. The range of each factor should be coded and set within the limits of -1 to 1 to ensure proper regression analysis, as the units of independent variables may not be the same, and even if they are the same, their selected ranges may differ. For this purpose, the following formula can be utilized:
Here, the factor code, actual factor value, and minimum and maximum factor values are defined. The actual maximum and minimum values for each of the independent variables are as follows:
– Lateral Slip Angle A (0 and 10 degrees)
– Tire Inflation Pressure B (10 and 20 psi)
– Vertical Load on Wheel C (200 and 3000 Newtons)
– Tension in Tow D (0 and 2000 Newtons)
– Angular Velocity of Wheel E (1 and 6 revolutions per minute)
Selection of Experimental Design
In response surface methodology, the Central Composite Design (CCD) was utilized in the form of a face-centered approach. In the face-centered configuration, the maximum and minimum limits are indicated by coded levels of (+1) and (-1), which provide the only information that needs to be input into the statistical software regarding the levels of each variable, according to the studies and research ideas. Thus, the third level is designated as the zero or central level (0), which represents a value between the minimum and maximum. If levels are defined outside of these three defined levels but fall within them, they can be easily coded.
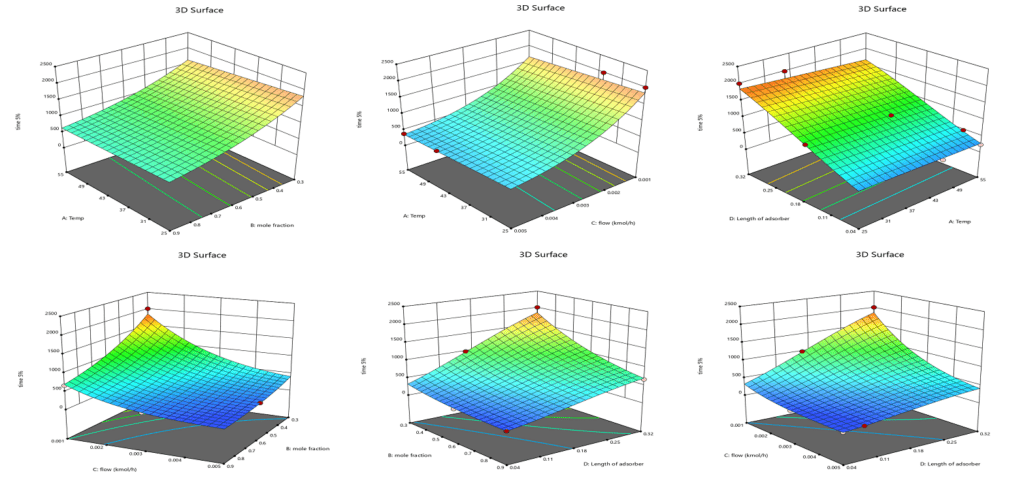
Statistical Plots for Model Description
To evaluate the performance and accuracy of the extracted models, the following six statistical plots were used:
Perturbation Plot:
This plot compares the effects of parameters at a specific point in the design space. A steep slope or curvature indicates the sensitivity of the response to that parameter.
Actual vs. Predicted Values Plot:
This plot examines the alignment between actual values and those predicted by the model.
Normal Probability Plot of Residuals:
This plot assesses the normal distribution of residuals. Non-linear patterns, such as an “S-shape,” indicate the need for a transformation of the dependent variable.
Box-Cox Plot:
This plot determines the best power transformation function to improve the model. The minimum point on the plot indicates the optimal lambda value.
Residuals vs. Predicted Values Plot:
This plot tests the assumption of constant variance. Random dispersion indicates constant variance.
Externally Studentized Residuals Plot:
This plot identifies outliers using control limits.
Response surface experiments were conducted using the Central Composite Design in a face-centered format. A quadratic model with desirable statistical characteristics, including a lower root mean square error and higher coefficients of determination, was selected as the best model for predicting lateral force on grass surfaces. Subsequently, a simpler model with fewer terms and an adequate coefficient of determination was obtained using a stepwise method. To assess model accuracy, the total sum of squares of the predicted residuals was calculated, and the model with the lowest total sum of squares of residuals was deemed to have greater validity.
In this study, the Central Composite Design (CCD) method and regression analysis were employed to analyze the data. The primary objective was to extract the coefficients of the torque model on grass with respect to the following independent variables:
Lateral Slip Angle (A)
Tire Inflation Pressure (B)
Vertical Load (C)
Tension Force (D)
Rotational Speed (E)
These variables were considered in coded values. To simplify the model, the Box-Cox plot was utilized, and a lambda (λ) value of -0.5 was selected. This choice contributed to improving the model’s performance and simplifying it. The proposed model exhibits suitable accuracy and reliability, effectively predicting the torque behavior on grass.
As a result, the extracted model, developed using advanced statistical methods and considering the influential variables, has successfully described the system’s behavior and can be utilized for further analysis and optimization.
Finding the Optimal Point for Traction Performance
Using Design-Expert software and its optimization section, the optimal point for maximizing the traction coefficient was determined. This point was achieved by minimizing the input torque, maximizing the net traction force, and minimizing slip.
After developing regression models to identify the optimal point for traction performance in the optimization section of Design-Expert, the input torque, traction force, and slip were introduced as objective functions. The ratio of maximum traction force to vertical load at the optimal points was found to be 0.00. The results obtained by Brixius and Wismer-Loth indicated the best traction performance at slip rates between 7% and 15%. In contrast, Al-Walid reported this value for high wheel numbers at slip rates less than 5%, and for low wheel numbers, it was found to be greater than 5%. It was shown that higher wheel numbers have a greater traction coefficient.
Validation
The validation of the ethyl acetate separation simulation from air in an activated carbon column is a process undertaken to ensure the accuracy and reliability of the simulation results. The main steps of this process are as follows:
System Definition and Modeling
Initially, the chemical and physical properties of ethyl acetate and activated carbon must be accurately defined. This includes selecting the appropriate model for the behavior of the gas and liquid phases and determining the operating conditions (pressure, temperature, and flow rate).
Modeling Assumptions
The following assumptions were made for the development of the mathematical model of the adsorption process:
– The processes are considered to be adiabatic and isothermal.
– The driving force is assumed to be linear.
– The mass balance under non-uniform conditions for the solute component in both the solid phase and the supercritical fluid phase leads to two partial differential equations.
– The resulting differential equations are solved using an implicit finite difference method.
Initial Simulation
Using simulation software, such as Aspen Plus, the separation simulation is conducted. This simulation should include design parameters of the column, such as height and type of packing.
Data Collection
To validate the simulation results, experimental data from actual ethyl acetate separation tests from air are collected. This data must include inlet and outlet concentrations and conditions that are comparable to those in the simulation.
Comparison of Simulation and Experimental Results
The results obtained from the simulation are compared with the experimental data. Key indicators, including the recovery percentage of ethyl acetate and outlet concentrations, are evaluated at this stage.
Deviation Analysis
If there is a significant deviation between the simulation results and the experimental data, an analysis of the causes of these deviations is conducted. This may involve examining model parameters, the type of packing, or operating conditions.
Model Optimization
Based on the results of the deviation analysis, the model may require optimization. This optimization could involve adjusting parameters or altering the selection of thermodynamic models.


Results and Discussion
The results obtained from the simulation indicate that the developed model demonstrates a satisfactory correlation with the experimental data. An examination of the effects of various variables, such as temperature, inlet concentration, and gas flow rate on the efficiency of the adsorption column, reveals an improvement in system performance under optimal conditions. This research is significant in that it achieves more accurate results by utilizing advanced equations and conducting a comprehensive analysis of the variables.

SANILCO
SANILCO, with a focus on simulation and mathematical modeling—particularly using
Aspen Plus software—possesses significant capabilities in this field. By employing advanced simulation methods, the company can accurately model industrial processes and conduct their analysis and optimization. Additionally, experimental design using Design Expert software is one of the key competencies of the company. This software allows for the design and execution of optimization experiments using statistical methods, enabling scientific analysis of the results. Overall, Anil Pars Process Industry Company contributes to improving performance and enhancing the efficiency of industrial processes through the combination of simulation and experimental design. This approach empowers clients to make better decisions in various aspects of production and processing.
Related Projects
Simulation of Water and Ethyl Acetate Separation Process with Aspen Plus
Simulation of 2400 Tons/Year Ethyl Acetate Production Unit
Design, Simulation and FS of 100KTY Ethyl Acetate Complex
Conclusion
This paper examined the significance and applications of simulation using
Aspen Plus software and experimental design with Design Expert. Simulation serves as a powerful tool, enabling accurate modeling of industrial processes and assisting in the analysis of system behavior under various conditions. This capability allows engineers and researchers to explore different scenarios and identify optimal solutions before actual implementation.
On the other hand, experimental design acts as a systematic approach to optimizing processes and reducing costs, playing a crucial role in improving product quality and increasing productivity. By utilizing the statistical methods available in Design Expert, data can be analyzed in a scientific and documented manner, yielding reliable results.
The combination of these two approaches—simulation and experimental design—enables companies and organizations to make smarter decisions in today’s competitive landscape and engage in the continuous optimization of their processes. In this project, Anil Pars Process Industry Company has conducted the simulation, modeling, and optimization related to ethyl acetate.